SearchPilot is coming up on its 1st birthday. We ran our original public pilot in February and March 2016, before launching in April. We now do more requests every few hours than we did during that pilot period! We thought it might be interesting to highlight some of the numbers that tell the story of that growth. Read on for the low-down, or skip to the end for the story of a split-test that added £100,000 in revenue per month.
Requests per month
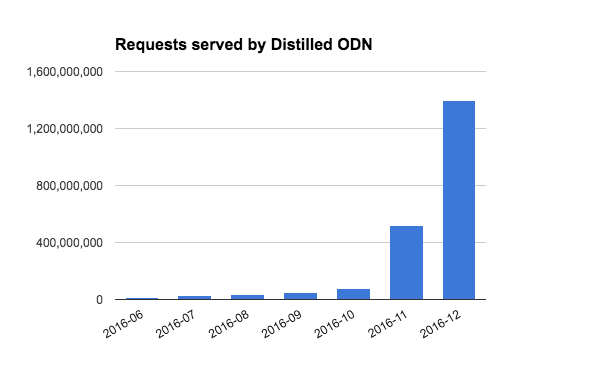
We don’t have detailed statistics for the earliest days, but we know that in June we were handling about 5 million requests a week. We have grown steadily since then, and in September we shared a traffic milestone:I'm not sure we've talked about this publicly yet. ODN is now handling 200 million+ requests / month. Want in? https://t.co/ROIyu7MSXm
— Will Critchlow (@willcritchlow) September 7, 2016
It was an exciting milestone, and it highlighted that the platform had matured over the 6 months since launch to be able to robustly optimise sites with good levels of traffic.
We have since launched in two more data centres and grew even more, such that we are now handling 50% more requests every week than we were doing per month in September:

Response time
The time it takes to adapt a page is a factor of how long it takes your servers to give us the page, where your servers are located (though we are now in the EU and both coasts of the US), and how large your HTML files are.
In the early days, we set ourselves the goal of handling customer requests within 100ms. We needed to fetch the page from the customer server, parse the page and apply any changes necessary for a test, then transmit that back out to the user or the customer’s CDN.
However, Google wants sites to return their HTML in 200ms, so we knew even if we got to 100ms, whilst negligible to most users (given the page load time is mostly images and scripts we don’t need to process) we would still want to get lower if we could.
Well, nowadays we are able to perform better than we had hoped - the following chart shows the average response time for one customer’s servers (57ms) and total response time including SearchPilot (73ms):
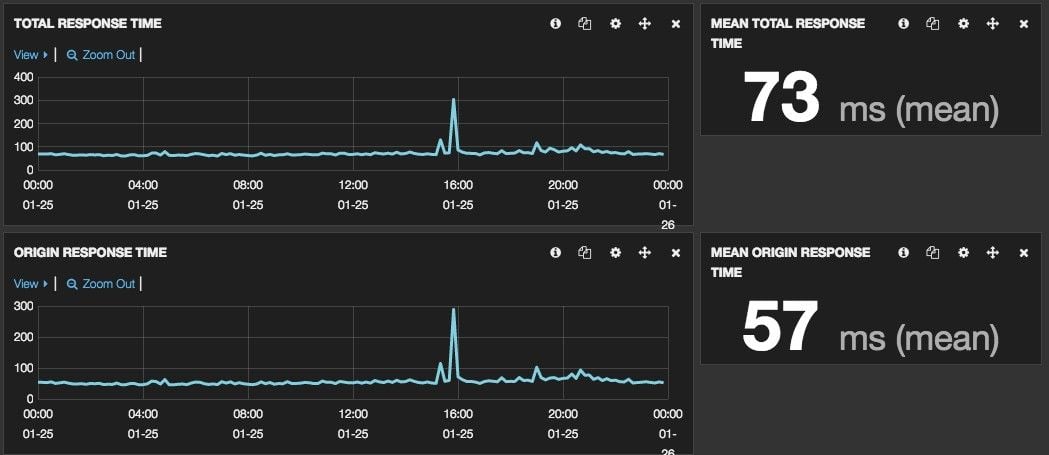
The customer above has a very performant website and they’re hosted in AWS - we add an average of 16ms latency to requests.
Dollars per day
During our pilot early last year we didn’t have any e-commerce sites where the checkout went via SearchPilot. In June we were handling traffic for sites doing around $5,000 a day. We are now processing thousands of dollars every minute (millions of dollars a day) - and we’re on a trajectory to doing hundreds of millions per month.
Biggest hour
As mentioned above, to begin with, we were handling around 5 million requests a week, which is about 8 requests per second. This has slowly and consistently climbed and normal traffic levels are now 300-1,000 requests a minute depending on the time of day.
However, on occasion, we see one of our customers run an offer, hit the news, or perhaps they’ve simply misconfigured something in their app, and their traffic will spike up.
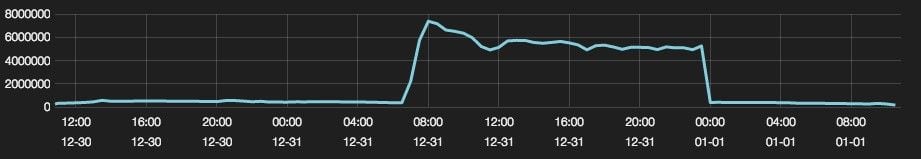
Our highest traffic came on the very last day of 2016. Just before 7 am our pagers started going indicating that our monitoring systems were seeing anomalous behaviour. We saw one of our larger customers have a traffic spike to 80-90 times their normal traffic.
They were getting over 4,000 requests a second, but the system had brought more servers online to deal with the spike and everything was working exactly as intended. We continued to serve the website in an average of 96ms per request during the period in the graph above.
Uptime
During our pilot period in February/March 2016 we had 16 minutes of downtime, but after launch, we saw out the rest of the year hitting 100% uptime, even with the New Year’s Eve spike in traffic detailed above.
Alas, in January 2017 a customer of ours was hit with a denial of service attack, which meant we were too, and for a period of 30 minutes we failed to handle about 3% of requests. We had missed our goal of a year at 100% uptime! However, it also gave us the chance to make some improvements to reduce the impact in the future, which have now been rolled into the platform.
Biggest test result
Perhaps the most exciting number of all! We generally measure the impact of our SEO split-tests as organic traffic impact, but for e-commerce customers, we are also able to calculate the revenue impact of a test by looking at their e-commerce reporting in Google Analytics.
We aren’t yet ready to share the details of our highest revenue impact test but the graph here tells a compelling story:
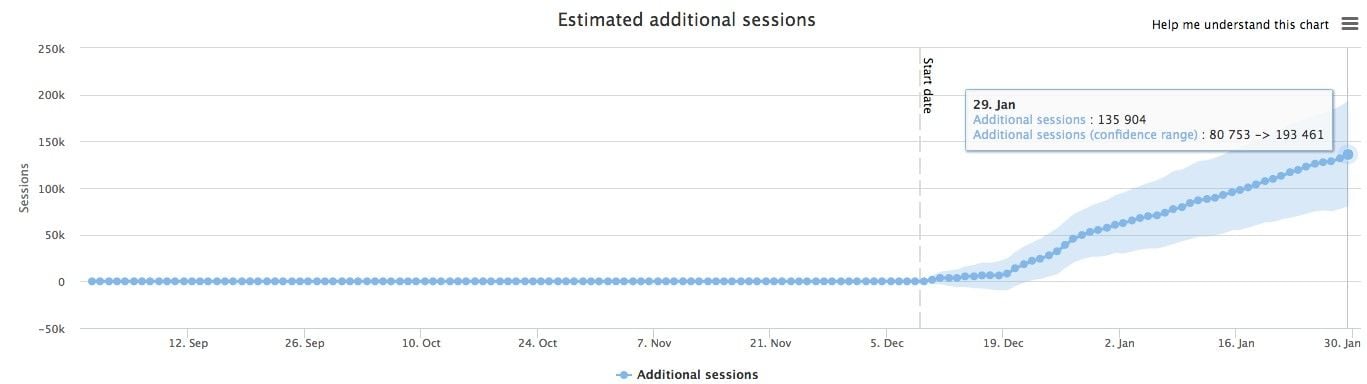
The test gained statistical significance quite quickly but we let it keep running as a bit of an experiment (the customer was already persuaded that this was something they should implement in their backend).
The graph above shows the total additional traffic to just the test pages during the time that the test was running to that point. We can do the same measurement against additional revenue to that point, and then use that to understand the likely revenue impact of rolling that change out across the whole site.
In this instance, the impact is estimated to be comfortably over £100,000 per month. It was a surprising result but the data is very consistent whatever way we look at it and even across multiple models. We’re totally excited about it from an SEO geek point of view, but it is also fantastic that we’re able to help in-house SEO teams measure the performance impact of changes they’re making.
Conclusion
There you have it; one year of SearchPilot distilled down to a single blog post. We’ve skipped over lots of it, but we wanted to keep it brief.
We’re already working with some exciting companies (see the image below) and if you’re interested in knowing more and potentially joining that list, please take a look around searchpilot.com or contact us for a demo. We think that the next year is going to be very interesting for SEO A/B testing, and are looking forward to being part of it.