![[Updated 2026] What is SEO A/B testing? A guide to setting up, designing and running SEO split tests](https://www.searchpilot.com/hs-fs/hubfs/SearchPilot%20true%20SEO%20testing%20diagram.png?width=800&height=450&name=SearchPilot%20true%20SEO%20testing%20diagram.png)
What is SEO testing?
SEO testing, also known as SEO A/B testing or SEO split-testing, involves changing a subset of randomly selected web pages to assess the impact of these changes on their organic search traffic. These modified pages are compared with a control group to account for external variables like seasonality or competition. Unlike user testing, which measures the impact of changes on website visitors, SEO testing evaluates how these alterations affect search engine rankings and visibility.
While that might sound straightforward, there’s a lot of confusion around SEO testing, so this guide hopefully helps to explain the main things to consider when designing SEO tests.
Feel free to jump ahead to the key sections below:
- SEO testing methodologies
- What types of websites can run SEO experiments?
- What’s the difference between user testing and SEO testing?
- How to design SEO tests
- SEO testing frequently asked questions
- What type of changes can you test?
SEO testing methodologies
The first thing that leads to confusion around SEO testing is language. A lot of what we see in the SEO world, often called SEO testing, is instead anecdotal evidence or badly controlled tests. I cover examples of both in this blog post: From Instincts to Impact - How to Design Robust SEO Experiments.
So to avoid doubt, when we talk about SEO testing at SearchPillot, we’re talking about running randomised controlled SEO tests. Unfortunately using SEO testing software like SearchPilot to run randomised controlled experiments hasn’t always been an option and still isn’t for many businesses. Instead, SEOs have had to rely on their hunches, best practices, or badly controlled tests to reverse engineer Google.
In clinical research, the robustness of your testing methodology is known as the ‘hierarchy of evidence’. My colleague Sam Nemzer wrote about this in The Hierarchy of Evidence for Digital Marketing Testing.
.png?width=960&height=540&name=Hierarchy%20of%20evidence%20(2).png)
How to run randomised controlled tests for SEO
If your goal is to determine causal relationships (and it should be), randomised controlled experiments are widely considered the best way to do that.
In a randomised controlled experiment, a representative sample of the population you care about is randomly divided into either control subjects or variants.
The advantage of randomisation is that it helps control for any bias in the bucketing.
In the SEO world, the “population” that we care about is a population of pages, not people. Even still, the process is the same. Pages should be randomly assigned as a control or variant page. Without randomisation, you could accidentally (or deliberately) exaggerate the impact of a test

Here are some examples of other testing methodologies broken into two categories, badly controlled vs observational.
Badly controlled SEO tests
- Quasi-experiments are when you only change a set of pages with a common property.
- Before-and-after studies, also known as pre-post studies, are when you change a group of pages without any randomisation or a control group to compare against.
- Single-case experiments are when you change something about a single page. For instance, a title tag or H1, then track the impact on traffic and rankings.
Observational SEO tests
- Case-control studies are backwards-looking. You find cases of some behaviour, for instance, a group of pages that have all increased or decreased in rankings, and compare them against pages that you deem similar but haven’t seen the same increase or decrease.
- Cross-sectional studies have some use in showing correlation at a point in time but aren’t helpful in understanding causality. For instance, you might gather lots of data points about sites in the top 10 results of Google, like the number of backlinks, site speed, word count, etc., and then use this to spot commonalities.
- Observational studies tend to be used where you can’t or wouldn’t want to create an intervention. For example, suppose you think building links from low-quality websites might damage your Google rankings. You wouldn’t want to build bad links just to find out you were correct.
- Lab studies would be setting up a dummy website to test a theory, for example, the impact of canonical tags.
What types of websites can run SEO tests?
Some websites and parts of websites aren’t suitable for running SEO split tests. To be able to run tests, there are two primary requirements:
- You need lots of pages on the same template.
- You need lots of traffic.
How much traffic? That’s a good question, and it depends on your website. Generally speaking, the more stable your traffic patterns are, the easier it will be to run experiments with less traffic. The more irregular the traffic to your website is, the more traffic you will need to build a robust traffic model.
We generally work with sites with at least hundreds of pages on the same template and at least 30,000 organic sessions per month to the group of pages you want to test on. This does not include traffic to one-off pages such as your homepage.
Can you test if you have less traffic? We’ve got some customers that test on sections of their site that only get a couple of thousand sessions per month, but the changes in traffic need to be much higher to be able to reach statistical significance.
The more traffic and pages you have, the easier it will be to reach statistical significance and the smaller the detectable effect can be.
Although not an exhaustive list, some example types of sites that are good for testing are:
- Travel
- Sites with lots of local pages
- Retail/E-commerce
- Recruitment/jobs websites
- Real estate
- Publishers
- Listings websites (eBay, Craigslist, events)
What’s the difference between user testing and SEO testing?
By far, one of the most common questions we get is some version of:
“Isn’t this just the same as user testing?”
That’s not surprising, given product teams and marketers have been doing user A/B testing for a long time, but there are some key differences.
User testing changes aren’t visible to Google
One of the other differences between user testing and SEO testing is the way that the changes are made to the page. Changes made to a site using client side tools likely aren’t visible to Google.
Most user testing tools use client-side methods to change the page during the test. That means the user requests the old version of the page from the server, the file arrives in the user’s browser, unchanged, and then JavaScript makes the change. One of the known drawbacks of client-side A/B testing tools is “flickering”. Users will often see the old version of the page before it quickly changes to the new version. See the image below.
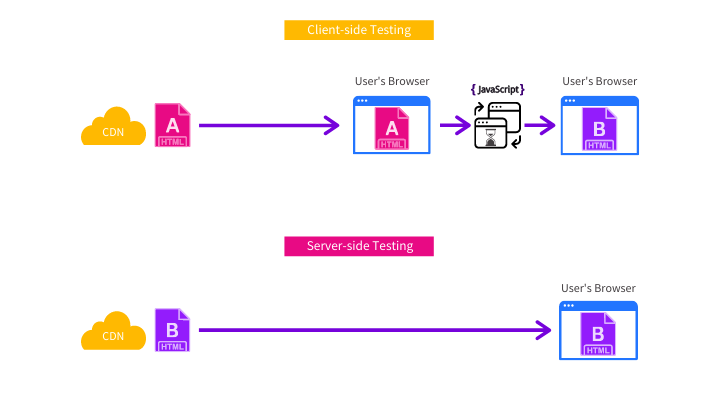
While flickering isn’t a great user experience, it’s generally not considered to impact the validity of the test results from a user perspective. Still, when testing the impact of a change on search engines like Google, using JavaScript can cause significant problems or even invalidate the results.
We’ve written a whole page about why server-side testing is better so I won’t repeat it here. However, the main point is that while Google understands more JavaScript than ever, it’s still not perfect and we frequently see uplifts in our tests from moving content from being client-side rendered to server-side.
This is most important if the JavaScript is slow to execute. There’s evidence to suggest that Google only waits five seconds for content to render, so anything that changes after this point will not be taken into consideration for ranking.
That’s pretty important if the point of the test is to see what Google thinks of the change.
For those reasons, SearchPilot is a server-side SEO A/B testing platform, that way, we can be sure that search engines see the changes that we are making and that we get the full benefit of those changes.
You can see how SearchPilot works in the image below.

User testing has a different methodology and goal
When testing for users, you make two versions of a page you want to test, and your testing platform will randomly assign users to either the A or B version of the page.
User metrics like conversion rate are then compared, and a winner will be declared if there is a statistically significant difference between the two pages.
We can’t do SEO A/B testing in that way for a couple of reasons:
- Splitting pages, not people: The “user” we are testing for is Googlebot, not human users. That means it’s not possible, for instance, to show 10,000 “Googlebots” control and variant pages randomly. There is only one Googlebot. You also can’t make two versions of a single page because it would cause problems like duplicate content. That’s why for SEO testing, we are dividing a population of pages into controls and variants as opposed to a population of users.
- Bucketing: In user testing, the number of users is normally large enough that you can assign users randomly to either control or variant without bias. But with websites, often a small number of pages can make up a large percentage of traffic, so you have to be careful to distribute your high-traffic pages evenly. For more information on this, see our post on smart bucketing for SEO testing.
The image below shows it clearly. With user testing, we see two versions of each page. With SEO testing, there is only one.

How to design SEO tests
There are five parts to designing an SEO test:
- Selecting a group of pages to test on
- Creating a hypothesis
- Bucketing pages into control and variants
- Making the change
- Measuring the results
I’m going to walk you through each step.
Selecting what pages to test on
Before you can start a test, you need a group of pages that all have the same template. For instance, on an e-commerce website, you could select a group of category pages or product pages; on a travel site, you could use destination pages or flight pages. See the example travel site below.
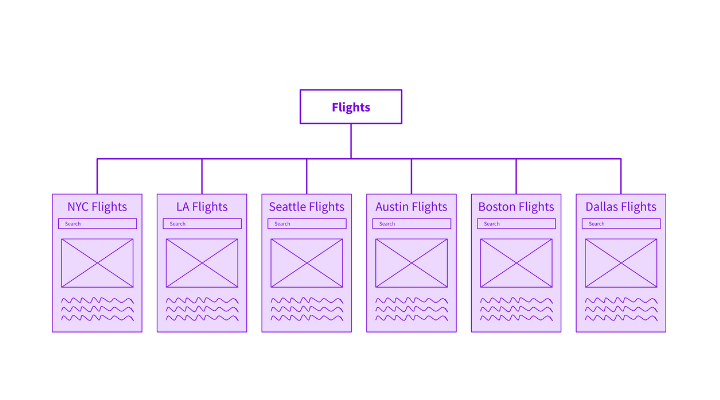
In reality, it’s unlikely that we would ever run a test on only six pages, but the principles are the same whether there are six, 600 or 6 million pages. Keeping it simple will make it easier to explain everything, especially when we get to the test analysis section.
Creating a hypothesis for your experiment
Although there are many differences between SEO testing and user testing, one common thing they both have is it’s essential to start with a solid hypothesis before you begin. We have a separate blog post that goes into more detail here: How to write a strong SEO hypothesis
I like to use this hypothesis framework from Conversion.com. You can see how I’ve applied the framework to the flight’s page template below as an example.
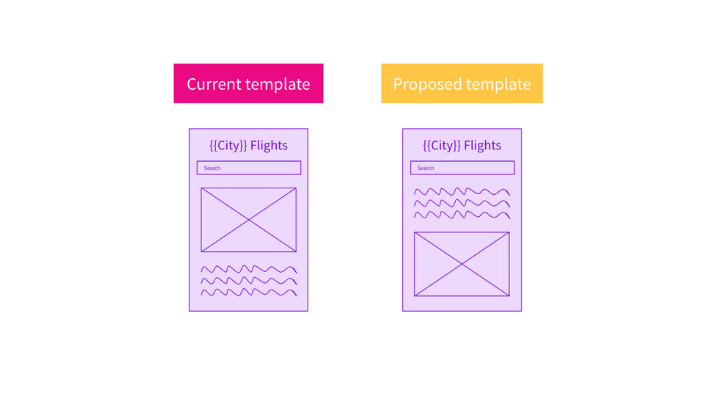
We know that: Google gives different levels of importance to content depending on its position on the page.
We believe that: Moving the content higher in the page will increase the importance of that text and therefore the relevancy of the page for our target keywords.
We’ll know by testing: Pages with content lower on the page compared to pages with the content higher on the page and observing organic traffic to each group of pages and measuring the difference in organic traffic.
Selecting control and variant pages (bucketing)
Once you know what you want to test, you next have to decide which pages will be control pages and which will be variants.
Deciding which pages should be in each bucket is one of the most important, yet least understood, parts of SEO testing. There are two main criteria to consider:
- Both buckets should have similar levels of traffic. You’re unlikely to get good or valid results if, for example, control pages have 10X as much traffic as variant pages.
- Both buckets should be statistically similar to each other. They should trend up and down at similar times. If they don’t, that would indicate some pre-existing bias in the buckets, and it will be harder to trust that any changes in traffic aren’t due to external factors that disproportionately impact only the control or variant bucket.
SearchPilot has a proprietary bucketing algorithm that automatically creates buckets that match both of those criteria.
Making the change to variant pages
After the buckets have been selected, the change needs to be made to just the variant bucket of pages. Once the change has been made, there will be two different templates live at the same time, but there will only be one version of each page.
Notice that half of the flight pages in the example below have the content higher on the template. Those are the variant pages.
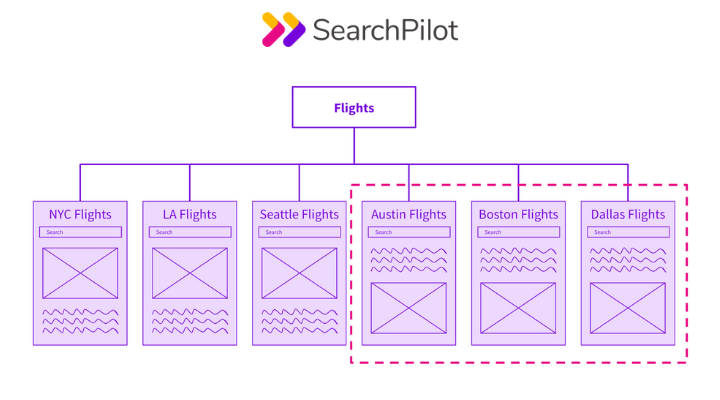
The fact that there is only one version of each page is a crucial point to note. It’s a common point of confusion for people new to SEO testing or those used to running user based A/B tests.
Regardless of whether a user or a search engine requests a page, they will see the same thing. This is covered in more detail in the section on the difference between SEO A/B testing and user A/B testing.
Measuring the impact of the experiment
The explanation I’m about to go through is a deliberate attempt to simplify the math(s) involved in SEO A/B testing. Our engineering team has spent almost a decade building a neural network to analyse SEO experiment results, so it’s unrealistic that I’ll be able to give a comprehensive explanation in a blog post. Still, I’ll do my best to cover the basics.
You can also read how we doubled the sensitivity of our SEO testing platform by moving to our neural network instead of the causal impact model that we used to use.
Step one - building a model
Before the test begins, we need to understand the organic traffic patterns to the control and variant pages historically before any changes are made. To do this, we use historical data to the two groups of pages (usually about 100 days of data) and use that to build a model.
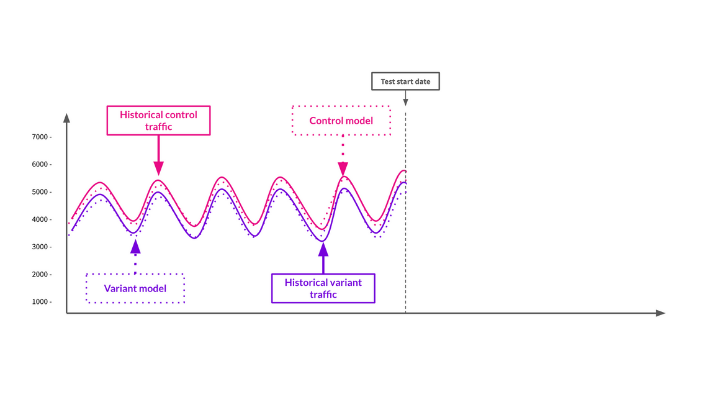
In the image above, you’ll see there are four lines, two are solid, actual traffic to control and variant pages, and two dotted lines, the models for the control and variant pages that we built using the existing historical data.
At this point, we have a few critical pieces of data that we need for SEO testing:
- We have a traffic model for the control pages.
- We have a traffic model for the variant pages.
- We also understand the relationship between the control group’s traffic and variant group’s traffic. For instance, you’ll notice that in this made-up example, the traffic to the control pages has historically always been slightly higher than the variant pages.
Step two - creating a forecast
To build a forecast, we use the models to predict what we think the traffic to these groups of pages would be in the future if we made no changes to either set of pages.
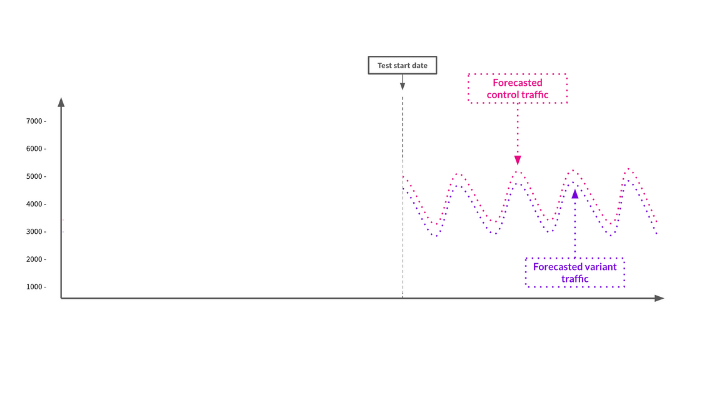
The image above shows the forecast for both groups of pages that were built using the models.
Now that we have a forecast of what we think should happen to the pages with no change, we can go ahead and launch the test and compare the real traffic to the forecasts.
Step three - monitoring the results
To explain how we monitor the results, we need to zoom into a day-by-day view. The easiest way to explain that is to embed the slides below. It would be hard to follow using individual images.
As you will see in the slides, we need to compare the forecasted traffic against the real traffic of each group of pages. We also compare the control pages’ real traffic to the variant pages’ real traffic.
Again, I want to stress that this is an oversimplification of the process. In reality, SearchPilot does all of this at the same time.
Although the slides only showed three data points, if the trend of actual traffic to the variant pages being higher than the control and the forecast continues, the result would look something like the graph below.
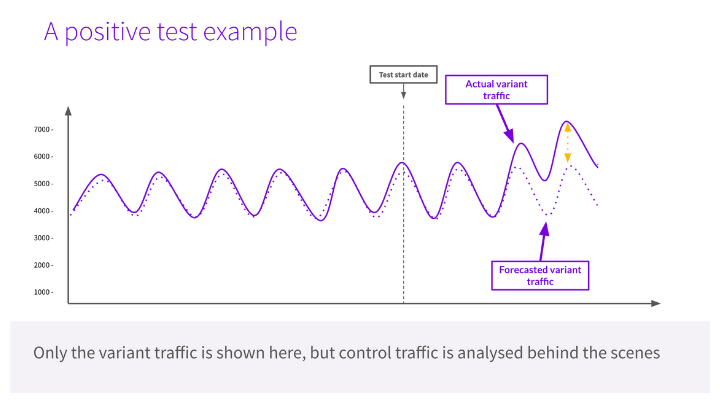
As you can see, there was a period where the forecast and actual traffic were aligned, and this is normal because search engines need time to crawl your website. That’s why you will often see a pattern of no change at first, followed by separation in traffic as Google considers the change. Depending on your website, search engines may crawl your website several times an hour, or it could take a week before they notice.
Step four - reaching statistical significance
The graph above is only half of the picture. It shows that there was a difference in the traffic, but it doesn’t tell us whether or not we should trust the result. To know that, we need a test to reach statistical significance.
It’s beyond the scope of this blog post to explain what statistical significance is or how it’s measured, but SearchPilot calculates this automatically for you. If you’ve seen any of our SEO A/B testing case studies, you will be familiar with the fan-shaped charts that we show.
Below is an explanation of how to read those charts.
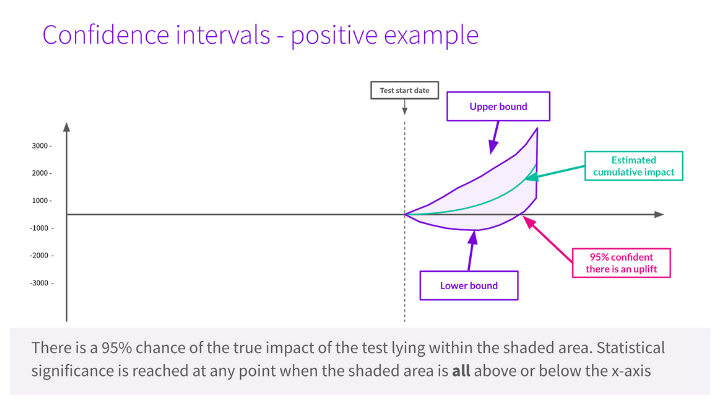
Unlike the previous charts, which show the day-by-day traffic levels (actual and forecasted), this chart shows the cumulative total impact over time, as calculated by our modelling process. The shaded area represents our 95% confidence range on this cumulative figure.
You’ll notice that early on, the shaded area of the chart straddles above and below the x-axis. At the beginning of a test, it’s more or less 50/50 whether a change is positive or negative. As the test continues and we gather more data, the shaded area may trend in a particular direction.
Eventually, the test may reach statistical significance if all of the shaded area is above or below the x-axis in the case of a positive or negative test, respectively. At this point, we become statistically confident in the result - typically at the 95% level, meaning there is less than a 5% chance of this result being observed if we had not changed anything.
Now that I’ve given you an overview of what SEO split testing is, I want to answer some of the most frequently asked questions.
SEO testing frequently asked questions
How do you account for external factors like Google updates and seasonality?
Another common question is how we know that any change in organic traffic is due to the change that we made and not external factors like seasonality, Google updates, competitors changing their websites, other sitewide changes, link building, TV campaigns, etc., during the test.
I previously mentioned that the way pages are divided into control and variant pages is essential.
To illustrate this point, I’m going to walk through a simple example of a pet website that wants to run a test on its product page template.
The site has 36 different product pages split between 6 different animal categories.
Like most websites, not all pages get the same amount of traffic and some pages are more seasonal than others.
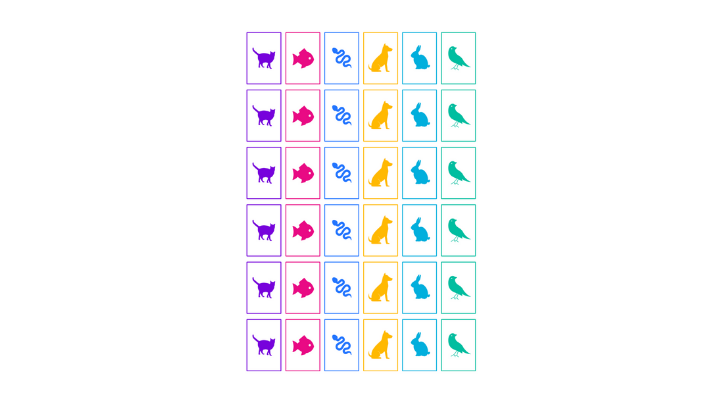
To run a test, they’ll need a control group of pages with 18 product pages and a variant group with 18 pages.
If we do the bucketing correctly, there should be 18 pages in each group. Each group will have similar levels of organic traffic, and they will be statistically similar to each other.
If you were to just randomly assign pages as control or variants, you might accidentally introduce a bias to the experiment. I’ll walk you through how that might happen and the effect it would have on understanding the results of a test.
Example of bad bucketing
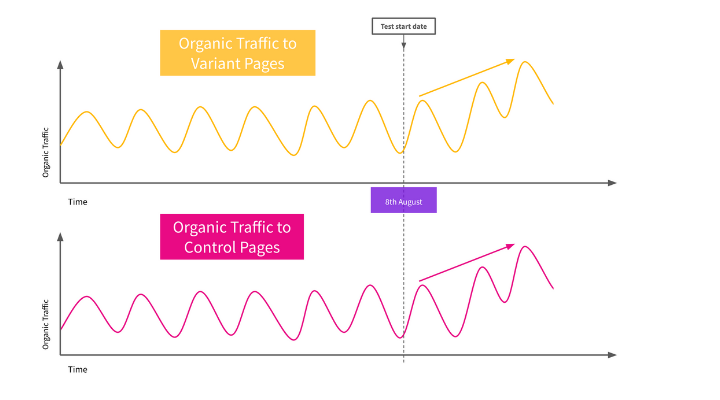
In the example bucketing image below, you can see that 100% of the product pages for each animal have been placed into the same bucket. For example, all of the cat products are in the variant group all of the dog pages in the control etc.
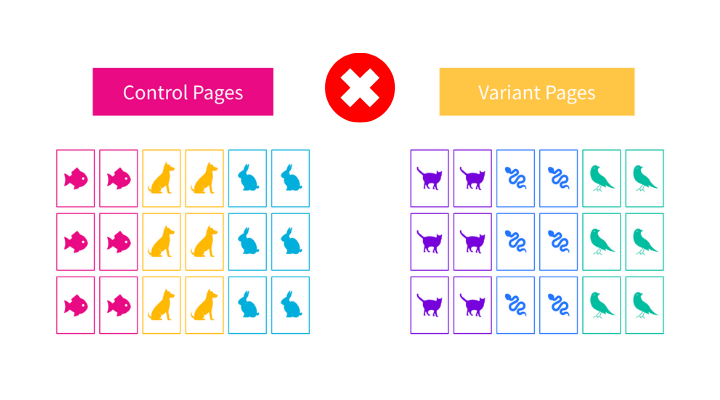
Let’s look at what happens when the test begins.
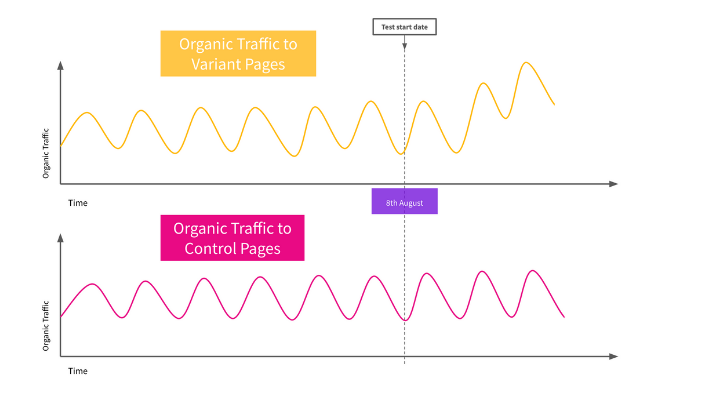
As you can see, this looks like a winning test. Traffic to the product pages in the variant group (shown in yellow) seem to have increased ever since the test began.
Unfortunately, this business got unlucky, little did they know they had launched a test on the 8th of August. They had no idea that this was International Cat Day in 2020.
This caused an influx of organic traffic to their cat product pages and as a result, made it look like the variant group’s aggregate traffic was performing better than the control pages' aggregate traffic. In reality, there was no significant difference between the two groups, and only a subset of the variant pages was receiving more traffic than forecasted since the test began.
Not every day is something like International Cat Day, but throughout a year we need to be able to run experiments irrespective of what’s going on in the real world, for example:
- Google updates
- Seasonality
- Marketing efforts
- Link building
- How your competitors are performing
- Other sitewide changes rolled out to your site
- Macroeconomic factors
- Products going in/out of stock
- Sales/promotions
This is by no means an exhaustive list. The point is that the world doesn’t stop because you want to run a controlled SEO experiment, we need to be able to accommodate the real world and work around it.
Example of good bucketing
The way we account external factors is by making sure we bucket the pages in a way that means both groups are statistically similar to each other. The example below shows a much better way of bucketing the pages.
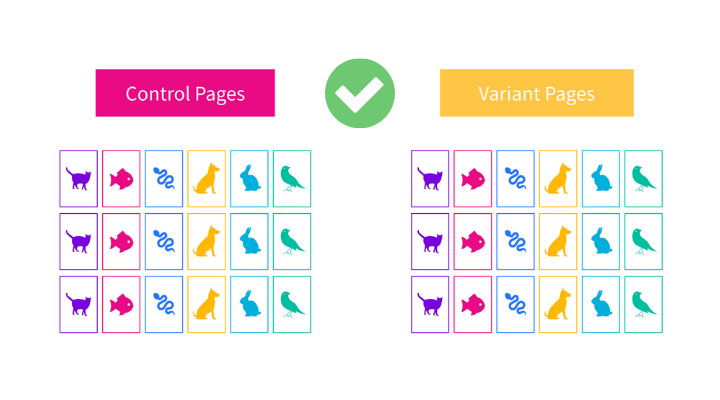
As you can see, there’s a more even split of product types in both groups of pages. Half of the cat product pages are in the control bucket, and the other half is in the variant bucket.
Let’s compare how the test performs with the improved bucketing.
As you can see, since the test began, traffic to both groups of pages has increased (because there are cat product pages in both buckets) so it would be clear that this had nothing to do with the experiment and must be something external that is increasing organic traffic.
Why don’t we use ranking data or click-through rates?
You might have noticed that throughout all of the explanations above, I never mentioned tracking keyword rankings.
We often get asked why we don’t use rankings or Google Search Console data like click-through rates in any of our analysis. This can be surprising for an industry that is obsessed with Google rankings.
There are three primary reasons that we don’t use either for our analysis. More on that here, but the summary is:
- Clickthrough rate (CTR) is a huge factor in how much organic traffic you get, and many SEO tests change how your site looks in the search results, and hence affect CTR. No position tracking tool can measure this
- Rank tracking can never cover the full tail of key phrases and will miss or misrepresent cases where the effect is different in the head vs in the long tail
- Search Console theoretically has CTR data and the long tail, but in practice is sparse, incorrect, or averaged
That’s not to say we never look at that data to understand the impact a change had. We use Google Search Console data for both rankings and click-through rate data, but it's for secondary analysis. We don’t consider it for primary analysis purposes. Organic traffic is our North Star.
Why do you need a forecast? Can’t you just compare variant traffic directly against the control?
The Google slides above are a reasonable attempt to explain how we use both the control group and the variant forecast together, but I’ll try and add some more detail here.
Although the two groups of pages have similar levels of traffic, and they are statistically similar to one another, the important word to pay attention to is similar.
They are different groups of pages and may for several reasons behave differently to each other or even differently from the way they have in the past.
To get the best possible results, it’s useful to think of using the control group and the variant forecast as two complementary tools:
- The forecast: useful for telling us what we think should happen to this group of pages based on the model that we built from historical traffic. There is no guarantee that the traffic patterns we observed in the past will continue in the future.
- The control pages: to account for the fact the past may not be representative of the future we use a similar group of pages (the control group) to tell us what else might be going on in the world that could be impacting the experiment and is independent of the changes that we are testing.
Both of these combined will produce more accurate results than either one used on its own.
Can you measure the impact on user behaviour & conversion rates?
If you want to measure the impact on user behaviour and search engines at the same time, we call this full-funnel testing. SearchPilot is the only platform that allows you to measure both at the same time.
I won’t explain everything here, you can read all about our full-funnel testing methodology here.
How long does it take to run SEO experiments?
The length of time it takes a test to reach statistical significance will depend on how much traffic your site gets and the size of the impact you are trying to measure.
Generally, positive or negative SEO experiments take 2-4 weeks to reach statistical significance, but a trend can often start to appear within less than a week. Watch this short video to learn more.
What version of the page does Google see? Is this cloaking?
I covered what version of the page Google sees in the section on the difference between user testing and SEO testing but I’ll explicitly answer the question here too.
When doing SEO A/B testing, there is only one version of the page. We are not showing different versions of the same page to users or Google.
We are making changes to a subset of pages that share the same template. This isn’t cloaking and doesn’t create any duplicate versions of the same page.
Can you use Google tag manager for SEO testing?
While you can make changes to a page using Google Tag Manager Google may not see the changes because they are being made using JavaScript. You can read more about this in the section about server-side vs client-side testing.
What type of changes can you test?
SEO testing is more than just titles and meta descriptions so I thought I would give some SEO testing examples.
SEO tests can vary in complexity. I’ve tried to give some examples below broken into beginner, intermediate and advanced and shared some case studies.
We have a whole library of SEO A/B testing case studies if you would like to see more.
We publish new case studies every two weeks; if you want to receive them, you can sign up to our SEO split-testing email list here.
Beginner SEO testing examples
On-page optimisation tests are relatively simple to design and launch. Examples would be things like:
- Title tags
- Meta descriptions
- H1s
Case study - Adding prices to title tags SEO A/B testing case study

Some other beginner tests would be things like:
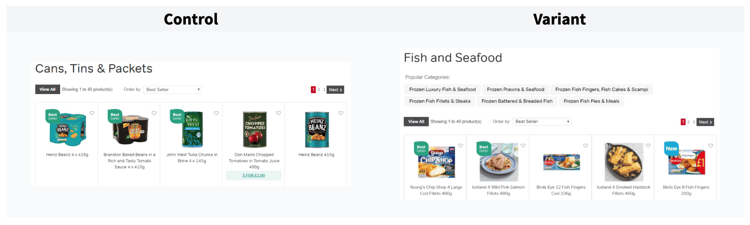
- Repositioning content that already exists on a page
- Adding or removing “SEO content” from category page
Intermediate SEO testing examples
Intermediate tests often require a greater understanding of HTML and CSS. Some examples would be things like:
HTML structure testing
- Bringing content out of tabs
- Reordering the HTML layout order
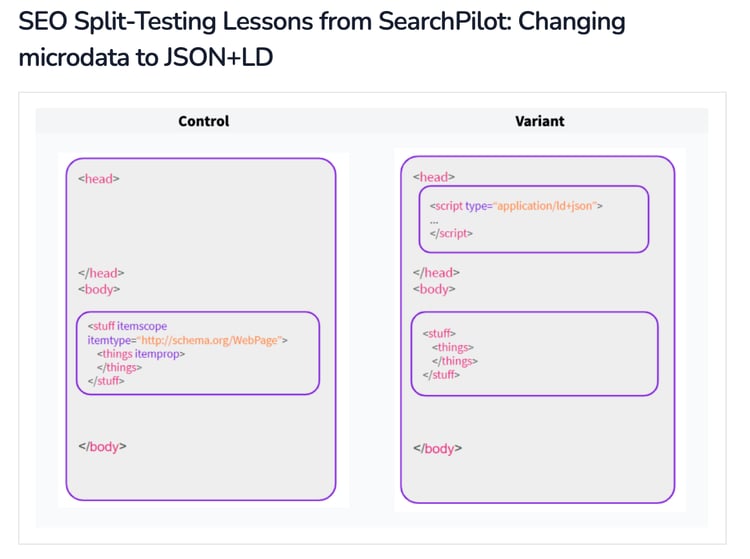
Structured data tests
- Testing structured data types (JSON vs Microdata)
- Adding FAQ markup
- Adding review markup
- Adding breadcrumb markup
Case study - Changing microdata to JSON+LD SEO A/B testing case study
Advanced SEO testing examples
Advanced SEO tests need a strong understanding of HTML, CSS and A/B testing methodology. Some examples are:
Internal linking tests
Internal linking tests require careful planning because as well as impacting the pages that you change, they affect the target pages that gain or lose internal links. You need to measure the impact on multiple groups of pages at the same time. Some examples of internal linking tests are
- Internal anchor text tests
- Adding or removing links to related products
- Increasing or decreasing the number of links to related products on shopping websites
- Linking to deeper pages in a site’s architecture
Some other more advanced tests are:
- Full landing page redesigns
- AMP page testing
Case study - Increasing internal links to sub-category pages - SEO A/B testing case study
If you’ve made it this far, thank you for giving me your attention. I hope you know more about SEO testing than you did when you started.
Please reach out to the SearchPilot team on Twitter if there is something you think I can add clarity to or if you have any questions.
