-1-1.png)
One of the important features of SearchPilot is taking care of the statistics and measurement automatically. Any time you set up a test, the platform will automatically:
- Create a forecast of expected traffic to the group of pages you’re testing on
- Create statistically similar buckets of control and variant pages
- Measure the organic traffic to the two buckets
- Calculate whether any difference in traffic is statistically significant
When we first built the tool, we used a measurement model that was based on the paper Inferring Causal Impact Using Bayesian Structural Time Series, which was published by Google. We’re announcing today that after months of beta testing, we’re now retiring that model and moving to a new neural network model which doubles the sensitivity of our previous best model meaning we can confidently detect uplifts half the size of the smallest we could detect previously. Improving the measurement capabilities of the platform has been many months of work and we’re extremely proud of it.
Detecting significant changes is really hard
We’ve spoken publicly at events like SearchLove about surprising test results and how hard it is to get winning results. Because of that, it’s extremely important that we can detect the smallest possible changes.
The old model that we’ve been using has served us well, but this new model allows two significant benefits:
- We can detect much smaller differences in traffic
- We can test on sites with a lot less traffic
As a rule of thumb, we used to recommend that you need at least 30,000 organic sessions / month to the group of pages that you’re testing. With the new model, we’ve been able to run valid experiments on site sections with less than 10% of that. We still recommend that more traffic is better but it’s interesting to push the limits of the model.
To make this more concrete, here’s an example of a test we ran recently with a side by side comparison:
Bayesian time series model (old model)
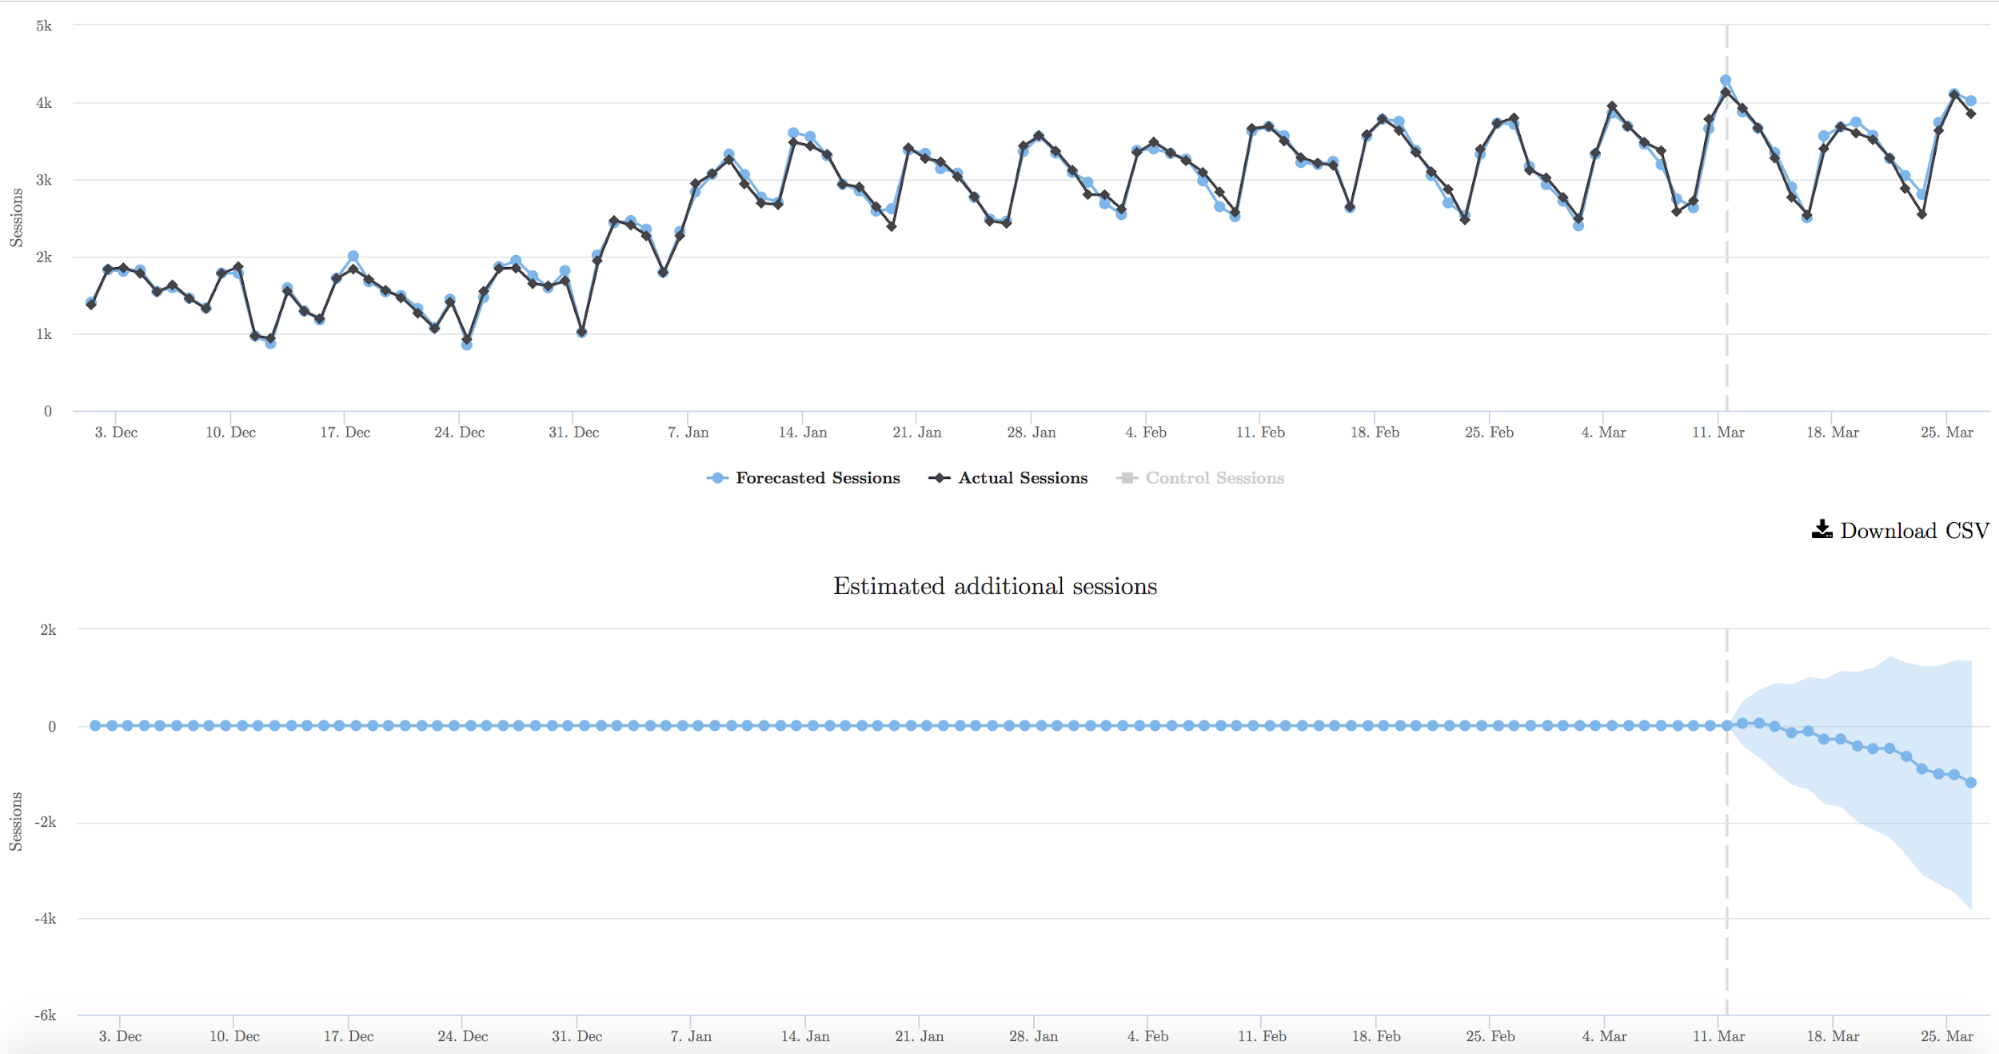
The image above is divided in two. The top graph shows the forecasted sessions in the blue line vs the actual sessions. In other words, before the test begins, the closer the blue and black lines are to each other, the better the model is. The dashed line towards the right of the image is the start date of the test.
The bottom half of the graph shows the estimated additional sessions since the test began. The blue shaded area is the confidence interval.
In this particular case, the graph is trending downwards but hasn’t reached significance yet. Given the difference in traffic is such a small amount, there’s a good chance this test would need to run a long time to reach significance, if at all.
Neural network (new model)
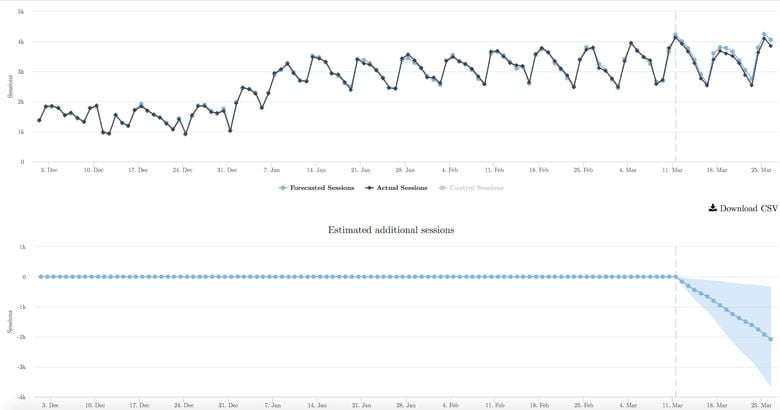
The image above is the same test, but this time it’s being measured using the neural network model. As you can see, the test reached significance quickly and was confirmed to be a losing test.
Unless you look really closely, it’s hard to see any difference at all, but if you zoom in, you’ll see the difference:
While this may not appear a big deal to some, being able to detect smaller changes, more quickly ultimately results in running more experiments and learning a lot more over a year.
If you’re in doubt about the value of detecting losing experiments, I highly recommend that you read this blog post: Marginal losses: the hidden reason your SEO performance is lagging
I want to give a shout out to everyone at Distilled [now SearchPilot] that worked on this update and made it possible. Thank you!
This new change will be rolling out across all of our accounts imminently. If it’s not already showing up in your account, it will be soon.
If you’re not doing SEO testing yet and you’d like to, get in touch for a free demo of our software.