
Years ago, it was fairly simple to be able to spark large changes within the search results and draw a firm connection between your SEO updates and a company’s revenue. Take a website that didn’t have much organic traffic nor metadata, add volume-rich keywords throughout and watch organic traffic levels climb.
How things have changed… The web is much larger today than it was 20 years ago, search engines have become increasingly complex and Search Engine Results Pages (SERPs) have become fiercely competitive as more companies invest in SEO efforts. The once-easy returns from SEO now take a tactical and data-heavy approach. With this shift in the landscape, proper investment in SEO requires better tools for research and strategy development.
However, being able to test for search engine impact is difficult for many companies. It can be incredibly resource-intensive, difficult to do correctly and the industry at large is riddled with habits that are directly affecting their test data and business decisions.
Today, we’ll be looking at three DIY SEO testing approaches, their downsides and other common pitfalls that can mislead your SEO testing efforts.
Pitfalls of common DIY testing approaches
Before / After SEO Testing
By far, the most common method for testing SEO changes on a website is with before/after testing. Before and after testing involves updating your website and comparing organic traffic levels and user engagement metrics before and after the change.
It’s likely the most popular because it’s easy to implement and has extremely low cost in internal resources. Unfortunately, this is where the positives of this approach end as it’s not a controlled test so it will be impossible to detect small effects, and larger impacts can be caused by confounding effects (like seasonality) making it easy to draw incorrect conclusions.
For example, search queries about taxes are highly seasonal. If you were to run any form of SEO test on tax-related pages during the month of April, it would be impossible to determine whether an increase in traffic was due to your changes or the increase in search volume.

At best with a confounded test, your test results are false negatives and you’re missing out on website updates that positively impact your organic traffic. At worst, you’re making changes that harm your organic traffic. Falsely labelling a website update’s impact leads to negative performance changes and makes it difficult to distinguish the reason behind a downturn in organic performance.
Measuring Performance by Rank Tracking
Often with before/after testing, we’ll see companies referring to rank tracking data to help determine a positive or negative result from an SEO test. However, rank tracking cannot give a comprehensive view of your performance in SERPs. Rank tracking cannot capture how your organic traffic performance is affected by a certain change because it doesn’t incorporate your click-through rate (CTR), the information is either sampled or averaged (or both), and it is impossible for external rank tracking to capture the full universe of keywords your website is visible for.
Overall, the before/after testing approach puts a lot of pressure and responsibility on your SEO team, who must interpret these results while factoring in a myriad of externalities – annual seasonality, concurrent marketing promotions, Google updates and competitor changes. When your job relies upon being able to communicate clear results that are transferable from testing to production, before/after testing is simply not dependable.
Client-Side A/B Testing Scripts
Another approach we see are A/B tests implemented via client-side scripts. This is not preferred due to challenges related to bucketing and visual layout changes.
Bucketing is the process of choosing your control and variant URLs. It is time-intensive and very difficult to produce good statistical matches between the two groups.
SearchPilot automates this process and evaluates historical data that results in control and variant groups with very similar levels of traffic and other statistical properties – better than any human could designate buckets. The better you separate the buckets for your test, the more accurate your results will be.
Any changes to the visual layout of the page are subject to both Cumulative Layout Shift and ‘flickering’, which can disrupt the integrity of your SEO test by impacting user-experience or Core Web Vitals metrics.
It’s also not guaranteed that Google will render the JavaScript completely. Running SEO tests client side makes every test a test of the hypothesis and a test of Google’s JavaScript rendering capabilities.
Laboratory SEO Testing
What we will refer to as ‘laboratory’ testing, is running tests on a domain meant purely for SEO testing. Although this can be useful for determining whether something is theoretically a ranking factor, the process comes with limitations:
- Just because you’ve documented an effect on the test domain, does not mean the impact is transferable.
- The test will not reveal the size of the impact because it’s unlikely they will have identical levels of traffic.
- There will be different CTRs between the domains and different levels of SERP- competition which will not be accounted for within this testing framework.
As a result, laboratory testing cannot help with building business cases, or even with telling whether a particular change will turn out to be positive in the real world.
Pitfalls of following “best practices”
Outside of the “how” you’re testing for SEO impact on your website, we’ve also noticed how being hyper-focused on SEO best practices can prevent good tests. We frequently meet customers that are running their SEO efforts off of ‘best practices’ and guesswork.
As our case studies have shown, guesswork and best practices are not a reliable strategy. Whether an update impacts your website negatively or positively is much more nuanced than the generally accepted standards within the greater SEO community. These SEO best practices are a great point to start your testing, but they should not be blindly depended upon.
Take these for example:
Fixing Breadcrumb Errors
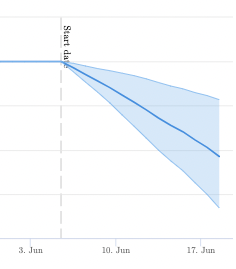
It seems safe to assume that fixing an error on your website would result in better organic search performance. Going into this test, we were quite certain that this was going to be an easy win for the client. This test resulted in a 12% percent decline in organic traffic for some site sections, however, simply because while the update did fix the breadcrumb markup, the rich snippet was less performant that not having it at all. Ironically, the breadcrumb error causing them to not display a rich snippet in the SERP was helping them.
Adding Price to your Title Tags
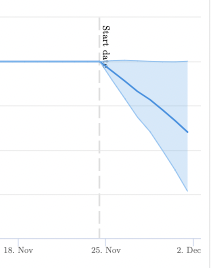
In this test we appended the price of the product on each page to the end of the title tag. Our twitter poll respondents for the weekly #SPQuiz overwhelmingly believed this update was likely to impact organic traffic positively. This test result was clearly negative and reminded us there are no ‘golden rules’ in SEO – everything needs to be tested.
Adding Alt Text
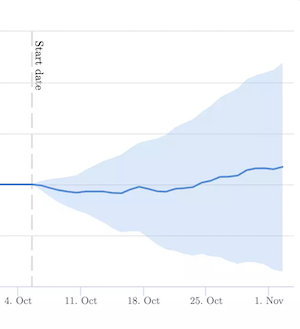
Thinking only about best practices exposes you to a risk of focusing large amounts of time on updates that don’t have an impact. Adding alt text on your images is often a large-scale project that leaves you wondering if the effort will pay off. As this test discovered, it didn’t have the desired impact on organic search performance.
In conclusion, don’t rely upon ‘best practices’ and ‘quick wins’; in the SEO world these should always be backed by testing. From our years of experience we are continually being challenged by the results of our experimentation. Taking an unbiased and scientific approach to forming test hypotheses and conducting SEO experiments are essential to successful and productive A/B testing for your organisation.
Heavy lift for internal team
Trying to split test effectively and avoid all of the common pitfalls that we’ve covered so far can take a substantial amount of internal resources. It is a balancing act and takes proper communication through the organisation’s SEO, Product, Engineering, Analytics, and Data Science teams to make effective tests and prevent any conflicts between departments – especially when engineering is needed to deploy each test. SearchPilot helps alleviate this by empowering the SEO team to discover the insights needed for success while bypassing a large amount of the effort required from other departments.
It’s likely that your biggest search competitors are not only A/B testing, they’re A/B testing changes at scale. It’s not only imperative to have a functioning SEO A/B Testing platform, but one that operates efficiently, allows a large variety of test ideas and can work through test ideas efficiently. The most effective SEO teams are frequent testers with a proper testing mindset and support from our professional services team.
Conclusion
Talking through the most common pitfalls of SEO testing goes to show that taking SEO A/B testing on yourself is a big investment – but it doesn’t have to be with the right tools and support.
If you’re wondering how to level up your SEO efforts in a trackable and manageable way or if you’d like to see the platform in action, sign up for a demo of SearchPilot by filling out the form at the bottom of the page.
Image credit: Billy Pasco.